What Are the Best Debugging Techniques?
The most effective debugging techniques are reproducing the bug, reading the complete error and stack trace, reducing the failure to a minimal case, using structured logs, inspecting variables with breakpoints, dividing the search area, checking system boundaries, writing a failing test, reviewing assumptions and verifying AI-generated suggestions.
Testing tells you that something failed. Debugging explains why it failed, identifies the root cause, corrects it and verifies that the defect cannot easily return.
First Identify the Type of Bug
The right debugging method depends on the failure category.
|
Bug type |
Typical symptom |
Start with |
|
Syntax or build error |
Code does not compile or parse |
Compiler output and first meaningful error |
|
Runtime error |
Crash, exception, blank page or HTTP 500 |
Stack trace and server log |
|
Logic error |
Program runs but gives the wrong result |
Breakpoints, watches and assertions |
|
Integration error |
Frontend, API or database disagrees |
Request, response, schema and data types |
|
Configuration error |
Works locally but fails online |
Environment and dependency comparison |
|
State or session error |
Wrong role, stale cart or inconsistent login |
Session, cache, cookies and database state |
|
Performance defect |
Slow page, timeout or high memory use |
Profiling, query timing and resource monitoring |
|
Concurrency defect |
Intermittent or duplicate updates |
Timestamps, request IDs, locking and race analysis |
10 Practical Debugging Techniques for Developers
1. Reproduce the Bug Before Editing Code
Record the exact account, role, input, URL, environment, expected result and actual result. A repeatable bug gives you a controlled experiment.
For intermittent failures, capture timing, network state, cache, session and the specific database record involved.
2. Read the Complete Error and Stack Trace
Do not stop at “something went wrong.” Inspect the exception type, message, application file, line number, SQL error, HTTP status, browser console and network response.
Start near the first stack frame that belongs to your application. For example, Undefined array key "email" often indicates missing input validation, not a warning that should simply be hidden.
3. Reduce the Failure to a Minimal Case
Remove unrelated code, fields and records until the smallest failing path remains. If a report crashes with 5,000 rows, test 10 rows and then increase the dataset. If an API request fails, send only its required JSON fields.
A minimal failing case reduces noise and can later become a regression test.
4. Use Focused, Structured Logging
A useful log entry answers: what operation failed, when, for which request, at which stage and with which safe contextual values?
level=ERROR request_id=8f31 action=login user_id=142
stage=password_verify result=false
Use a request or correlation ID to connect frontend, API and database events. Never log passwords, session tokens, OTPs, payment data or unnecessary personal information. Production users should receive a generic message while technical details remain in protected logs. OWASP recommends controlled application logging and warns against exposing sensitive implementation details to clients.
Students learning server-side diagnosis can also review FileMakr’s backend development skills guide.
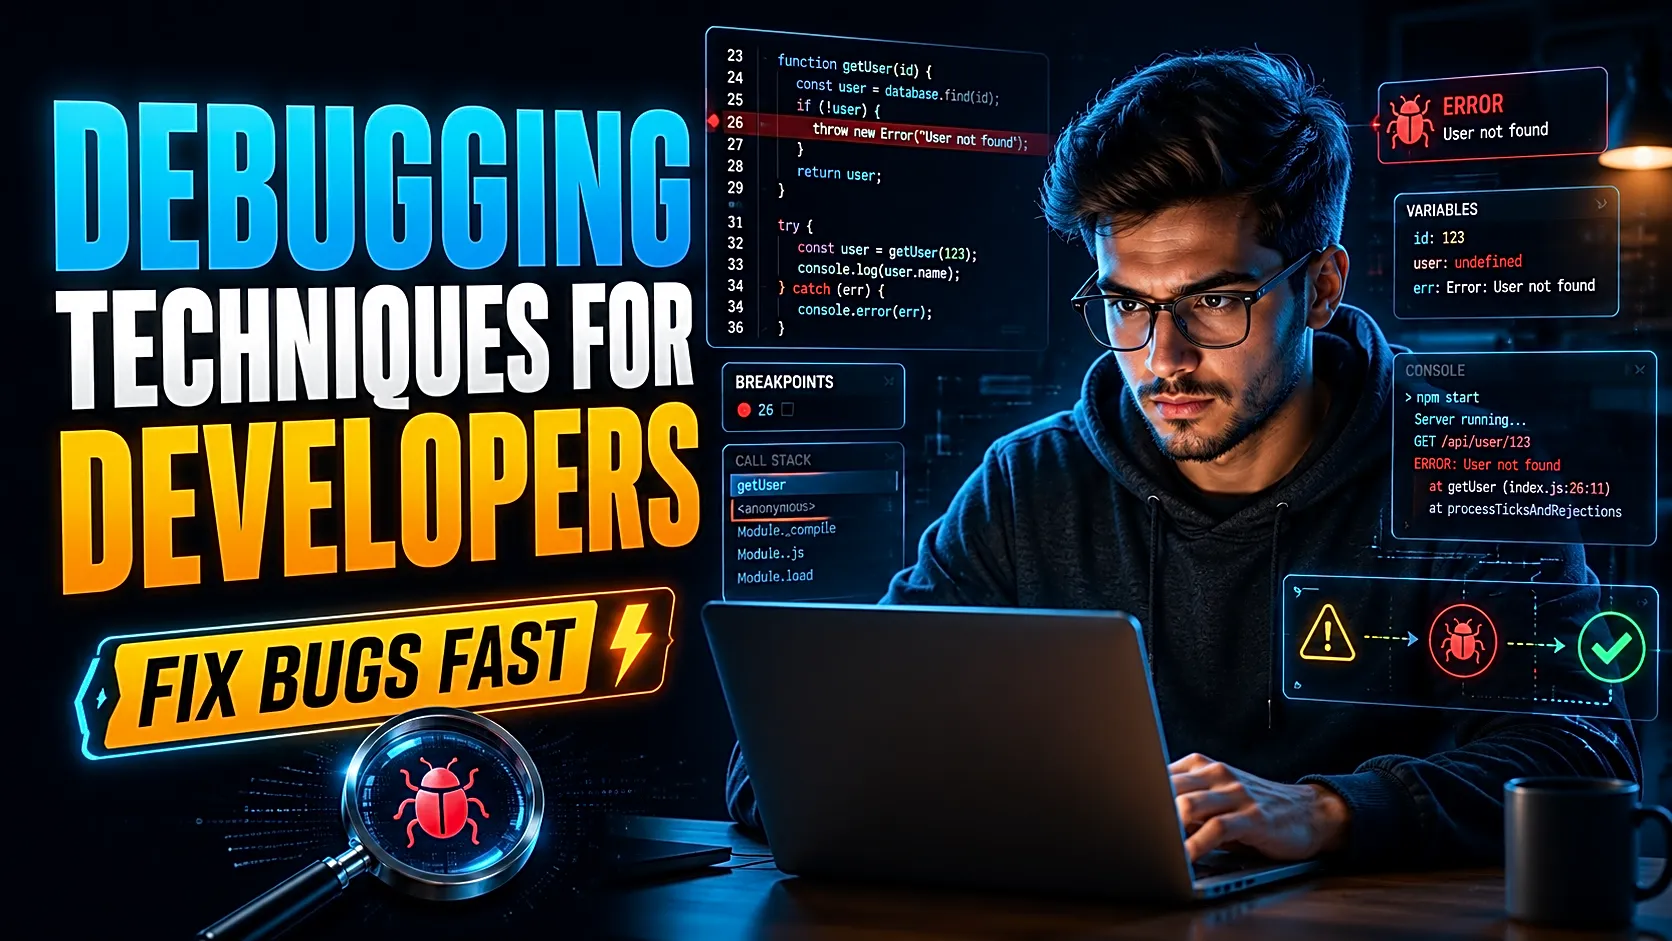
5. Use Breakpoints, Watches and the Call Stack
A debugger lets you pause execution, inspect variables, evaluate expressions and step into or over functions. Use a conditional breakpoint when only one loop record fails, and a watch expression when a value changes across several functions.
Useful starting commands include:
Python: breakpoint()
Python: python -m pdb app.py
PHP: error_log("Order ID: " . $orderId);
For frontend issues, Chrome DevTools can pause JavaScript, inspect the call stack, watch expressions and examine network requests.
The related FileMakr guide explains additional frontend development skills, including browser debugging and API integration.
6. Apply Divide-and-Conquer Debugging
Place an observation point near the middle of the suspected flow. Determine whether the failure occurs before or after it, then repeat on the failing half.
The same principle works with version history. When a feature worked in one commit and fails in another, use:
git bisect start
git bisect bad
git bisect good <known-good-commit>
Git then narrows the history until it identifies the first bad change.
7. Inspect Every System Boundary
Many web-application bugs occur where data moves between components. Inspect:
- HTML form to controller
- Frontend to REST API
- Controller to service
- Application to database
- Authentication middleware to session
- Local environment to deployment server
Compare field names, data types, null handling, date formats, HTTP methods, status codes, SQL parameters, environment variables, permissions and dependency versions.
For API work, the FileMakr guide to building a REST API for student projects provides a useful reference flow.
8. Write a Failing Test Before the Fix
Turn a repeatable defect into a test. If a cart accepts quantity zero, write a test asserting that quantities below one are rejected. Apply the smallest fix, rerun the test and keep it in the suite.
Use unit tests for isolated calculations, integration tests for API or database flows, and end-to-end or manual cases for complete screens.
9. Explain the Code and Challenge Assumptions
Describe the failing flow aloud, line by line. State what each variable contains and why each condition should be true. This rubber-duck process exposes assumptions that were never verified.
When requesting a review, provide reproduction steps, exact errors, relevant code, expected and actual output, and the checks already performed. Avoid sending an entire repository when a focused example is enough.
10. Use AI as a Hypothesis Generator
AI can explain an error, propose tests or identify likely failure points. It can also invent methods, overlook project-specific rules, recommend outdated dependencies or produce an insecure patch.
Share only sanitized snippets. Ask for multiple hypotheses and a test for each one. Accept a suggestion only after logs, debugger output, official documentation, database results or automated tests confirm it.
A Systematic Debugging Process
Use this sequence whenever a defect appears:
- Define expected and actual behaviour.
- Reproduce the bug consistently.
- Collect errors, logs, requests and database evidence.
- Classify the fault area.
- Form one testable hypothesis.
- Run one controlled experiment.
- Apply the smallest root-cause fix.
- Retest the original path and neighbouring features.
- Add a regression test and document the cause.
Recent professional-software research characterizes debugging as an iterative diagnostic process: each observation updates the developer’s mental model and determines the next useful investigation.
Representative Case: PHP/MySQL Login Returns HTTP 500
Suppose a student login form works locally but returns HTTP 500 after deployment.
Expected: The student reaches /student/dashboard.
Actual: The browser displays a generic server error.
The browser response alone is insufficient, so the server log is checked. It reports that password_verify() received null. The submitted email is present, and the database connection succeeds. The prepared statement then reveals that the production database column is named password_hash, while the deployed PHP code reads $row['password'].
The root cause is a schema-to-code mismatch, not an authentication-algorithm failure.
The smallest correction is to use the correct field consistently or add an explicit alias:
SELECT id, role, password_hash AS password
FROM users
WHERE email = ?
Verification should cover a valid login, invalid password, missing email, inactive account, correct role redirect and a user created after deployment. A regression test should assert that the authentication repository returns the required password field.
This case shows why “works on my machine” bugs often require environment, schema, configuration and dependency comparison. Students can explore additional PHP projects with source code to practise tracing complete authentication and database flows.
Local and Production Debugging Are Different
In local development, you can pause execution and display detailed errors. In production, avoid exposing stack traces or SQL details to users.
Prefer protected logs, request IDs, monitoring, sanitized reproduction data, health checks and a rollback plan. After deploying a fix, monitor error frequency, response time, database failures and the affected user journey.
A technically correct patch is incomplete until production behaviour remains stable.
Common Debugging Mistakes
Avoid changing several files at once, hiding errors instead of fixing them, logging secrets, testing only the happy path, ignoring environment differences and deleting temporary evidence before the defect is understood.
Small Git commits make regression debugging easier. The FileMakr guide to GitHub projects for students can help you structure repositories and document changes clearly.
Frequently Asked Questions
What is debugging in software engineering?
Debugging is the process of reproducing, locating, understanding, correcting and verifying a software defect.
What is the difference between testing and debugging?
Testing reveals that behaviour differs from requirements. Debugging investigates the reason, fixes the root cause and confirms the correction.
Is logging better than using a debugger?
Logging is usually better for deployed, distributed or intermittent failures. An interactive debugger is often better for a reproducible local logic error.
How do I debug an API 500 error?
Inspect the request payload, server log, exception, route, validation, authentication middleware, database operation, environment variables and returned status. Do not expose the internal stack trace to the client.
How do I debug a database connection error?
Verify that the service is running, then check the host, port, database name, credentials, user permissions, driver, environment variables and exact connection error.
How do I debug a bug that occurs only sometimes?
Add timestamps and request IDs, preserve the failing input and state, compare successful and failed runs, and investigate timing, caching, sessions, concurrency, external APIs and environment conditions.
Can AI debug an entire project?
AI can accelerate an investigation, but it does not reliably know every dependency, database record, environment setting or business rule. Treat its output as a hypothesis, not proof.
Conclusion
Effective debugging is an evidence-based cycle: reproduce, observe, isolate, hypothesize, test, fix and verify.
Use stack traces for crashes, logs for runtime evidence, breakpoints for state inspection, tests for repeatable defects and Git history for regressions. Inspect boundaries carefully, protect sensitive data and document the root cause.
For students, these habits lead to safer demonstrations, stronger test cases, cleaner project reports and clearer viva explanations. Explore FileMakr’s final-year project source code and project ideas to practise these techniques on complete applications.
Sources and Further Reading
Chrome DevTools debugging and breakpoint documentation.
Python pdb documentation.
Git bisect documentation.
OWASP application-logging guidance.
Research on professional debugging strategy and diagnostic reasoning.
The article body is approximately 1,780 words, including headings, tables and source notes.